I think importance sampling also makes sense from a variance perspective:
If we consider x as taking values from -inf to inf, the mean amount of light across all possible values of x is essentially 0, hence it would make sense to sample at points with high variance, i.e. where f(x) deviates from zero.
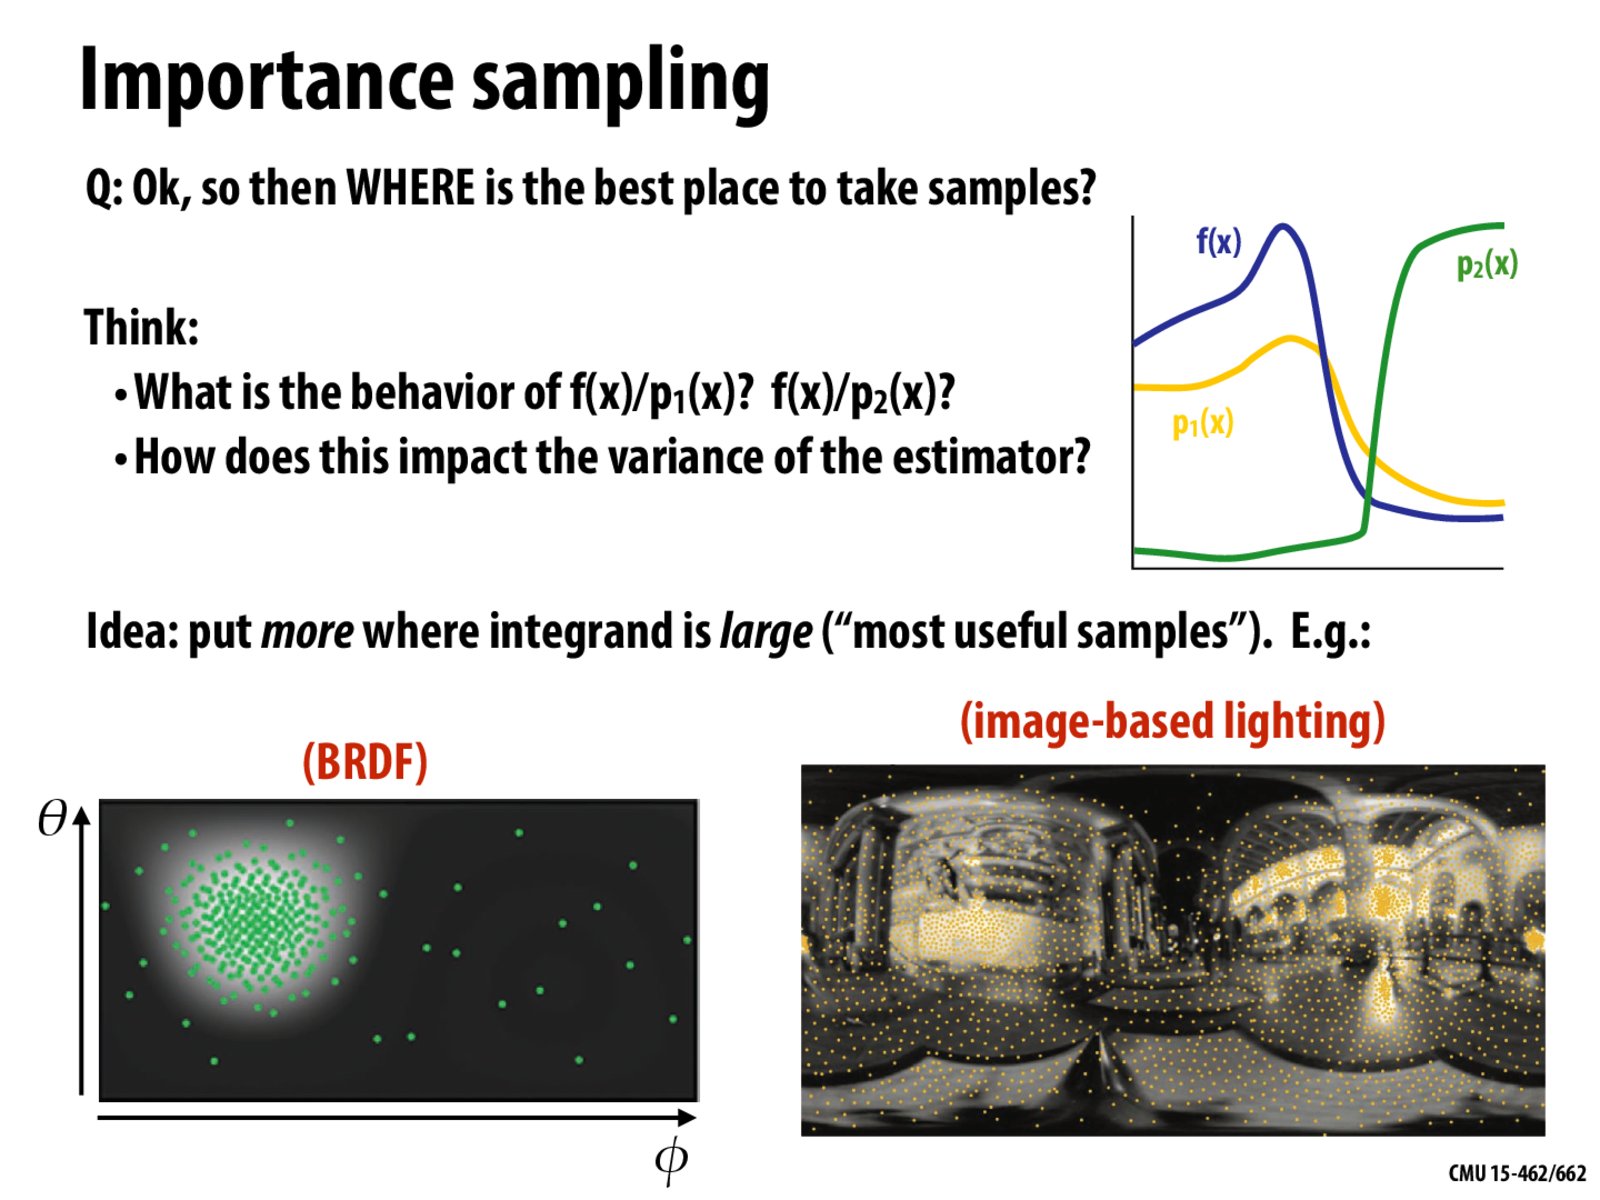
While, in the context of the BRDF, the integral is over finitely many values of theta and phi, the same idea applies that for a single light source, most sample points will have little to no light coming from that light source, so the mean is close to zero.
Conversely, if there was uniformly a lot of light across the hemisphere, it would make sense to sample uniformly as well since the variance is equal throughout the hemisphere.
I think for the f(x) in the example above, for the values of x shown in the graph, the mean would be somewhere in the middle of the plotted y-axis, so technically both the left and right sides of the graph have similar variances and a uniform sampling might do better? Either way, p_1(x) is still a better choice than p_2(x), but I think it's not the best illustrative example for the other sampling examples on the slide?
I think importance sampling also makes sense from a variance perspective:
If we consider x as taking values from -inf to inf, the mean amount of light across all possible values of x is essentially 0, hence it would make sense to sample at points with high variance, i.e. where f(x) deviates from zero.
While, in the context of the BRDF, the integral is over finitely many values of theta and phi, the same idea applies that for a single light source, most sample points will have little to no light coming from that light source, so the mean is close to zero.
Conversely, if there was uniformly a lot of light across the hemisphere, it would make sense to sample uniformly as well since the variance is equal throughout the hemisphere.
I think for the f(x) in the example above, for the values of x shown in the graph, the mean would be somewhere in the middle of the plotted y-axis, so technically both the left and right sides of the graph have similar variances and a uniform sampling might do better? Either way, p_1(x) is still a better choice than p_2(x), but I think it's not the best illustrative example for the other sampling examples on the slide?