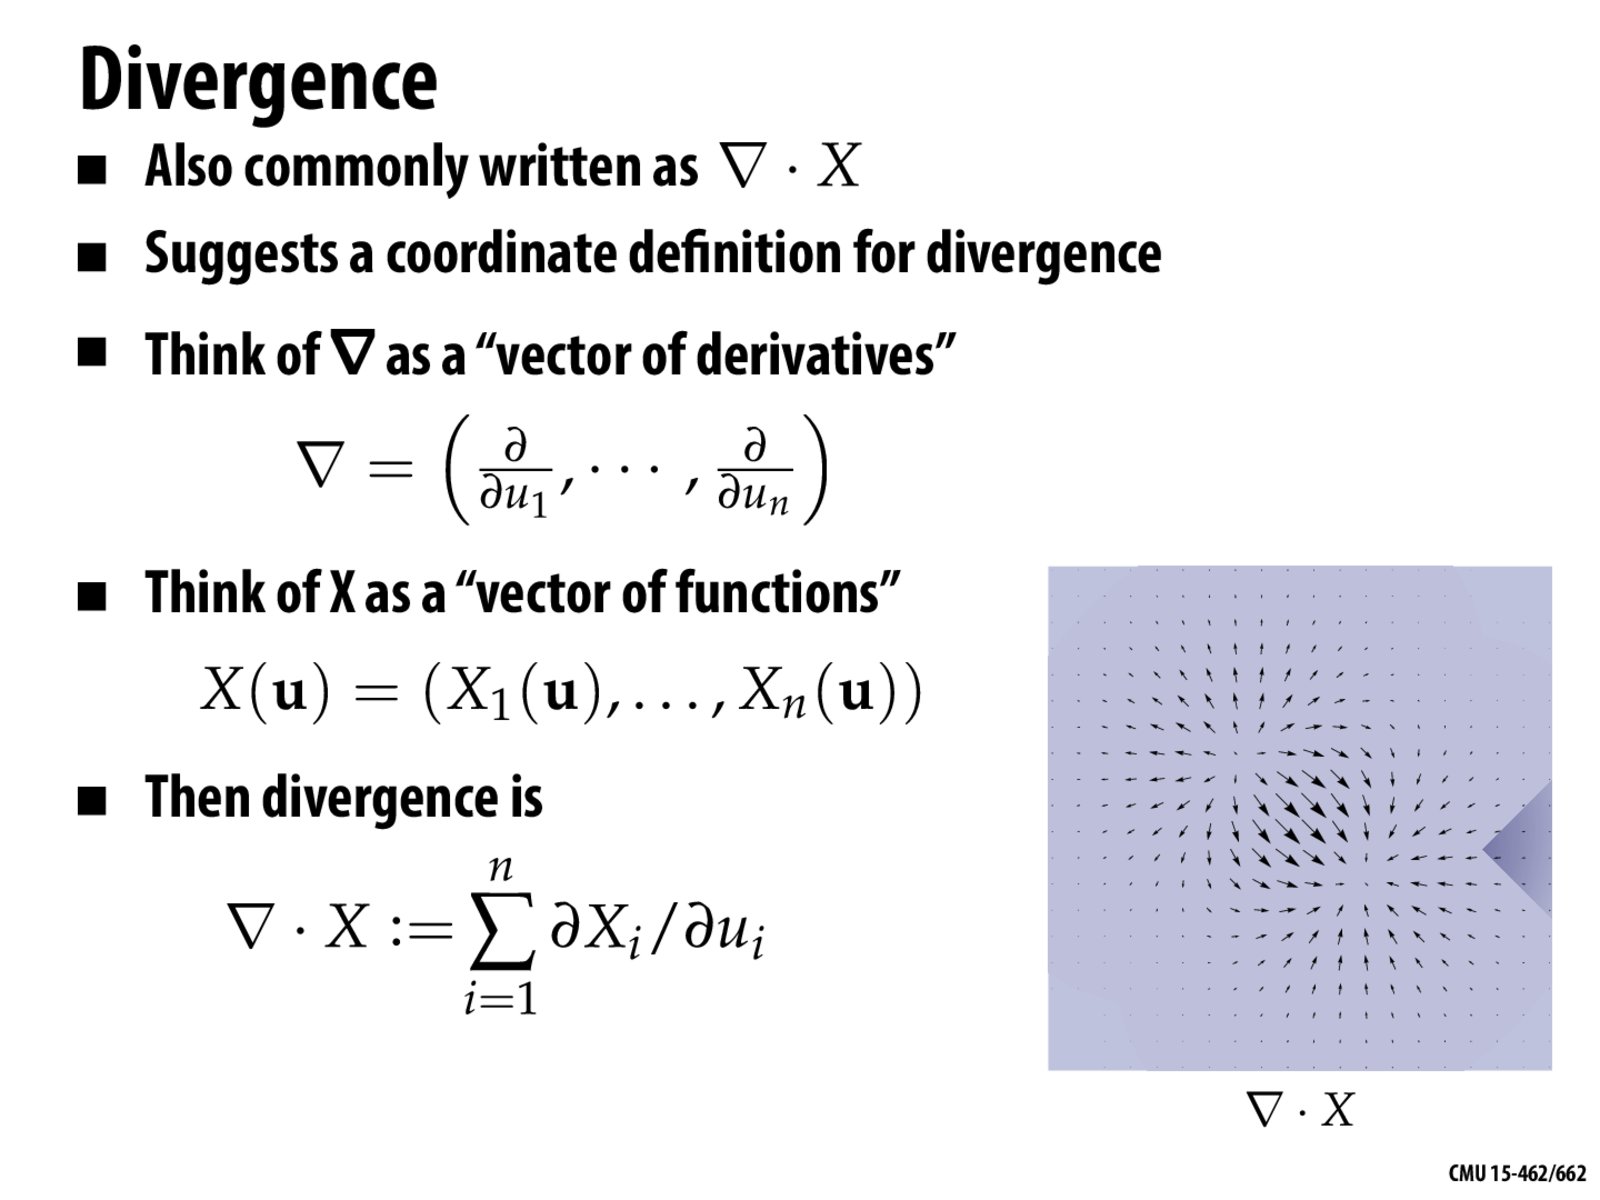
I am a bit confused why \nabla \dot X is a vector at each point due to this graph? I thought it should be a scalar value due to the last equation in this slide.
keenan
@yongchi The color in the plot is the divergence; the original vectors are just overlaid on the plot for reference. This may be clearer in the PDF; the conversion to the web version seems to have corrupted this particular image.
I am a bit confused why \nabla \dot X is a vector at each point due to this graph? I thought it should be a scalar value due to the last equation in this slide.
@yongchi The color in the plot is the divergence; the original vectors are just overlaid on the plot for reference. This may be clearer in the PDF; the conversion to the web version seems to have corrupted this particular image.