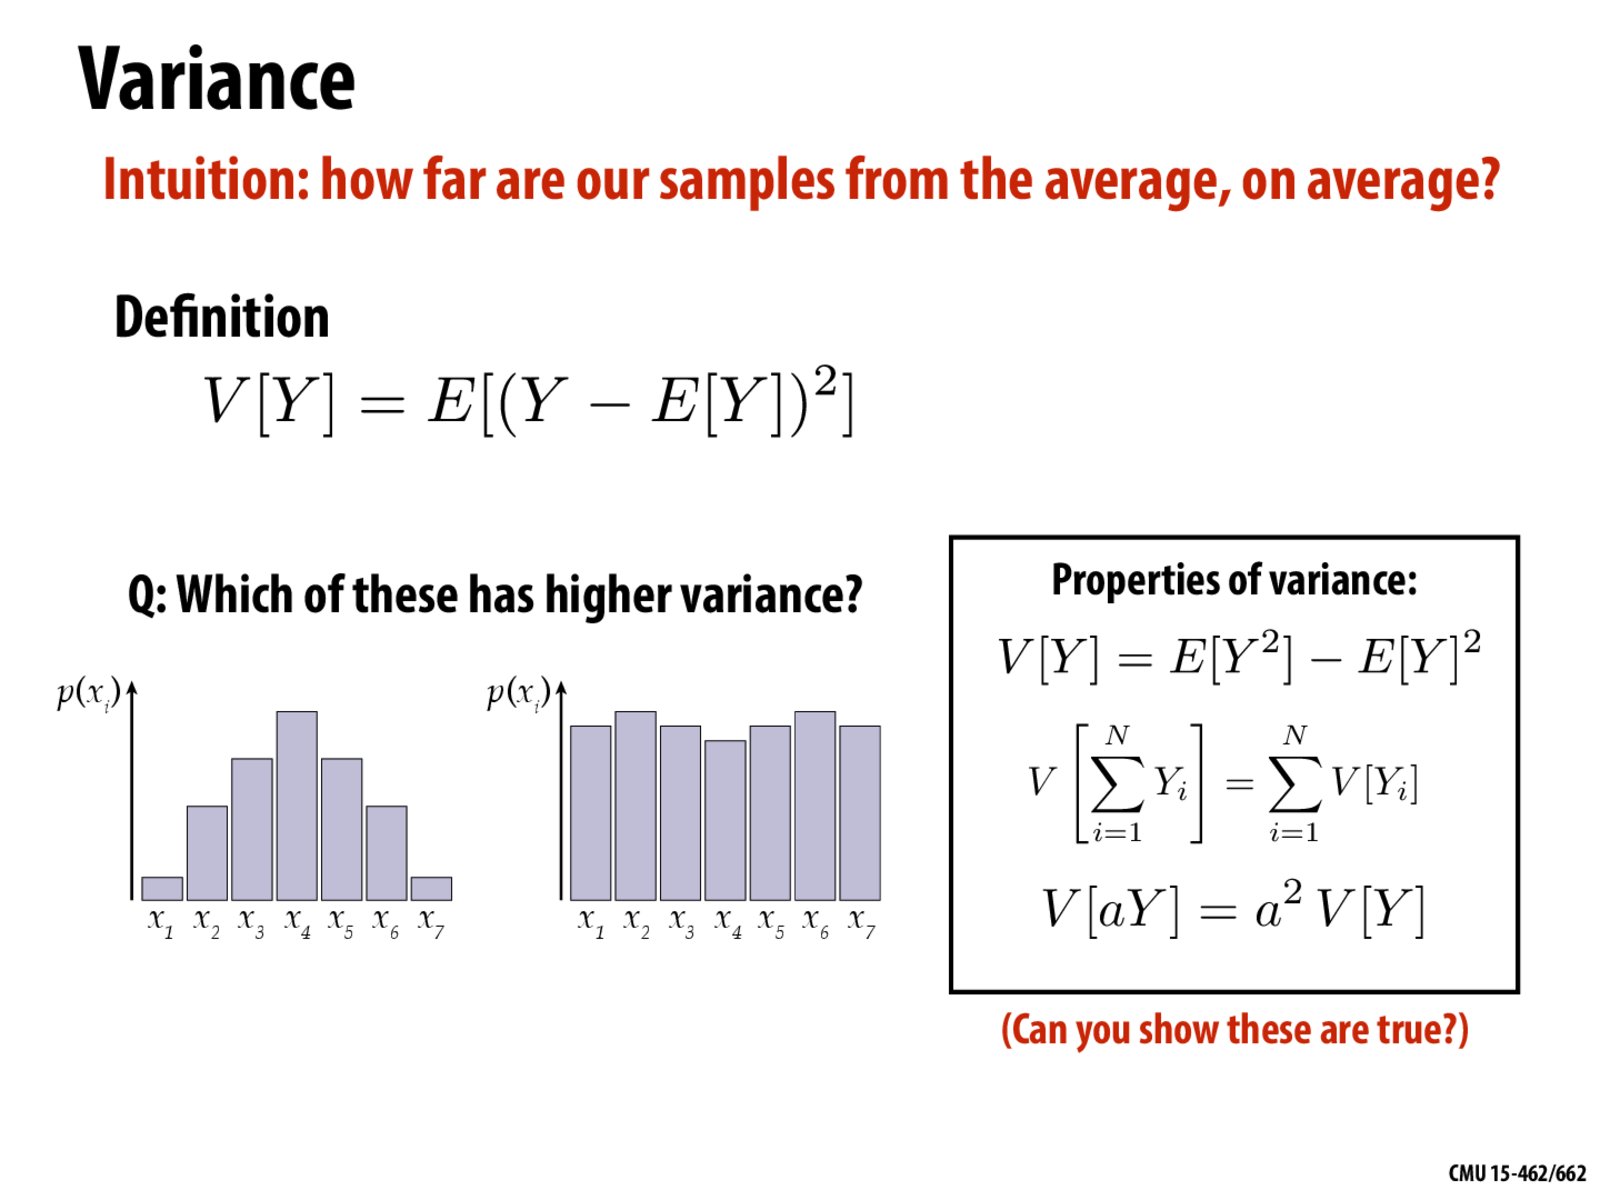
We said in class that the graph on the left would have a higher variance, but this graph is plotting probabilities and not numerical results. Wouldn't that imply that the second one has a higher variance because there's a higher chance of getting a value far away from the expected value?
We said in class that the graph on the left would have a higher variance, but this graph is plotting probabilities and not numerical results. Wouldn't that imply that the second one has a higher variance because there's a higher chance of getting a value far away from the expected value?