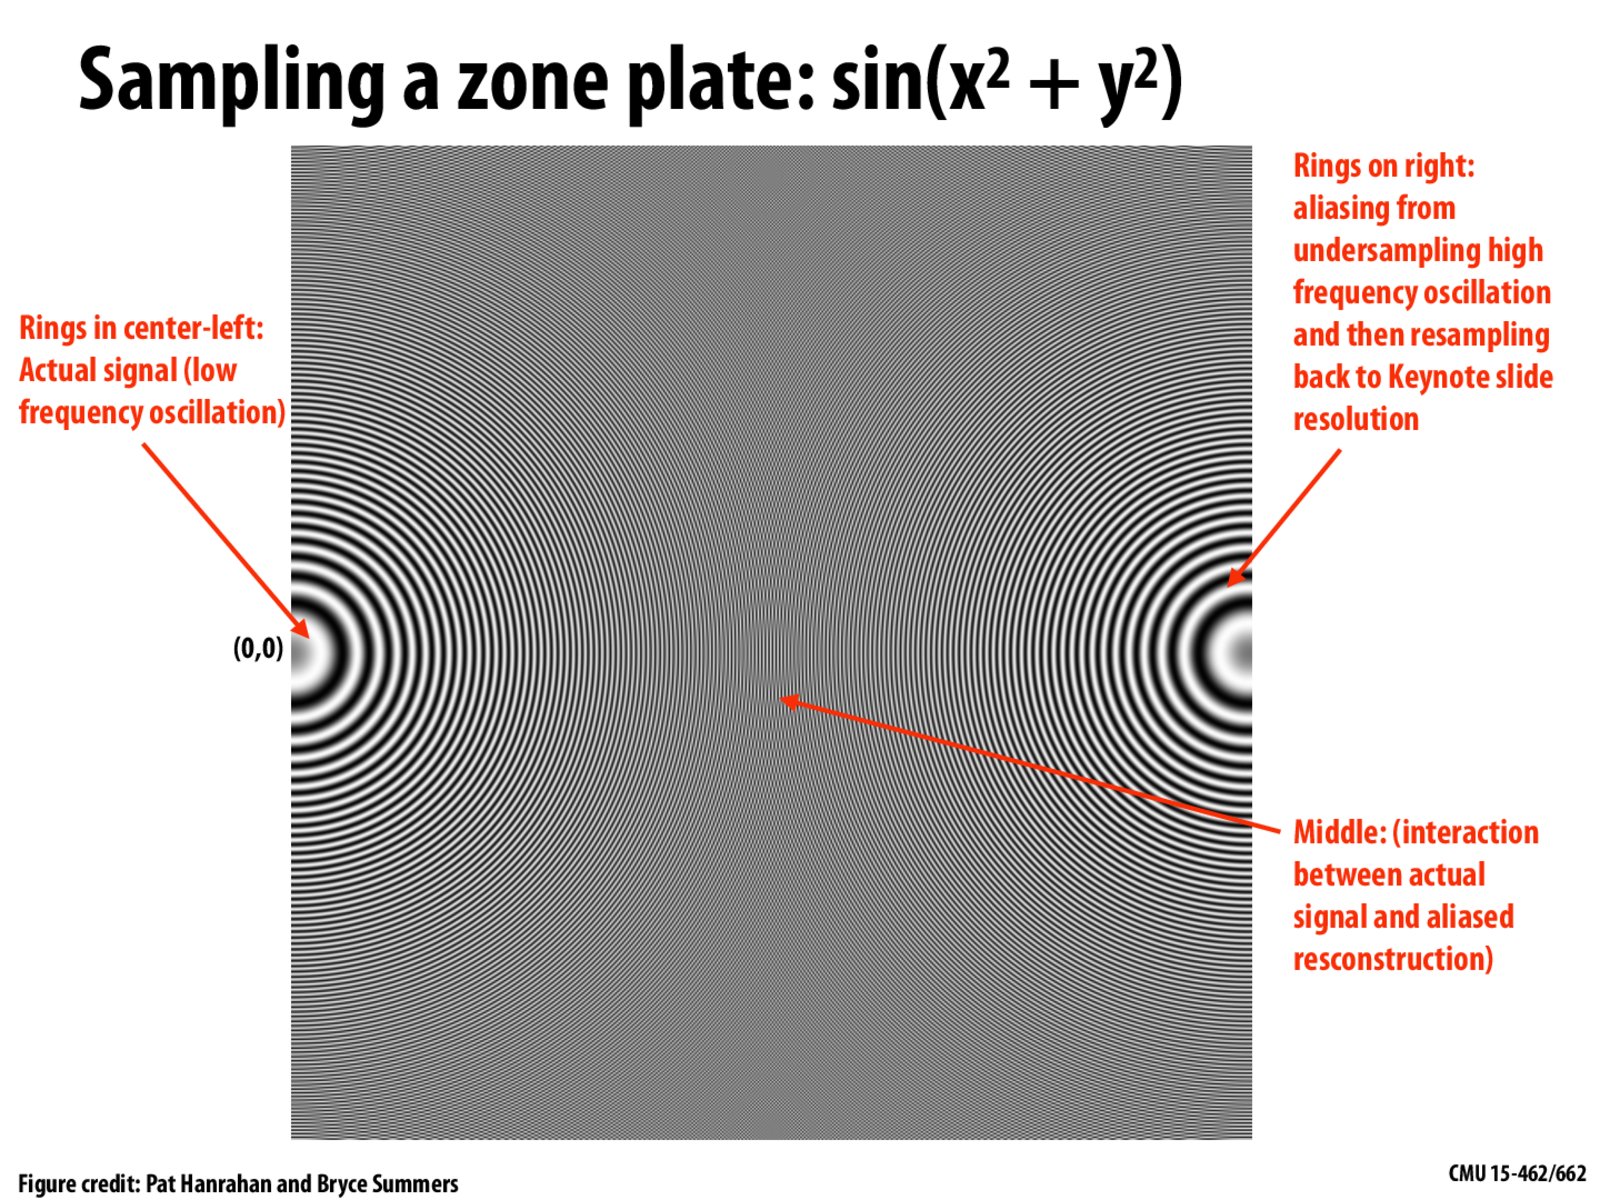
How does this graph make sense? I understand that aliasing happens due to a low sampling rate, and that the graph that we see now is not a true representation of the actual graph, but how exactly does it form the symmetric pattern on the right?
motoole2
It is not guaranteed to produce a symmetric pattern or this exact pattern, because the appearance of the aliased signal on the right-hand side depends on the sampling frequency. If you have MATLAB installed, try the following to see a similar pattern based on the same function:
How does this graph make sense? I understand that aliasing happens due to a low sampling rate, and that the graph that we see now is not a true representation of the actual graph, but how exactly does it form the symmetric pattern on the right?
It is not guaranteed to produce a symmetric pattern or this exact pattern, because the appearance of the aliased signal on the right-hand side depends on the sampling frequency. If you have MATLAB installed, try the following to see a similar pattern based on the same function:
[x,y] = meshgrid(linspace(-1,1,1000),linspace(-1,1,1000));
imagesc(sin(2.*pi.*1000.*(x.^2+y.^2)))