The weird patterns in the back were explained using aliasing, but I don't understand why this is being represented by a continuous function (like the signals) rather than say a set of intersecting lines.
motoole2
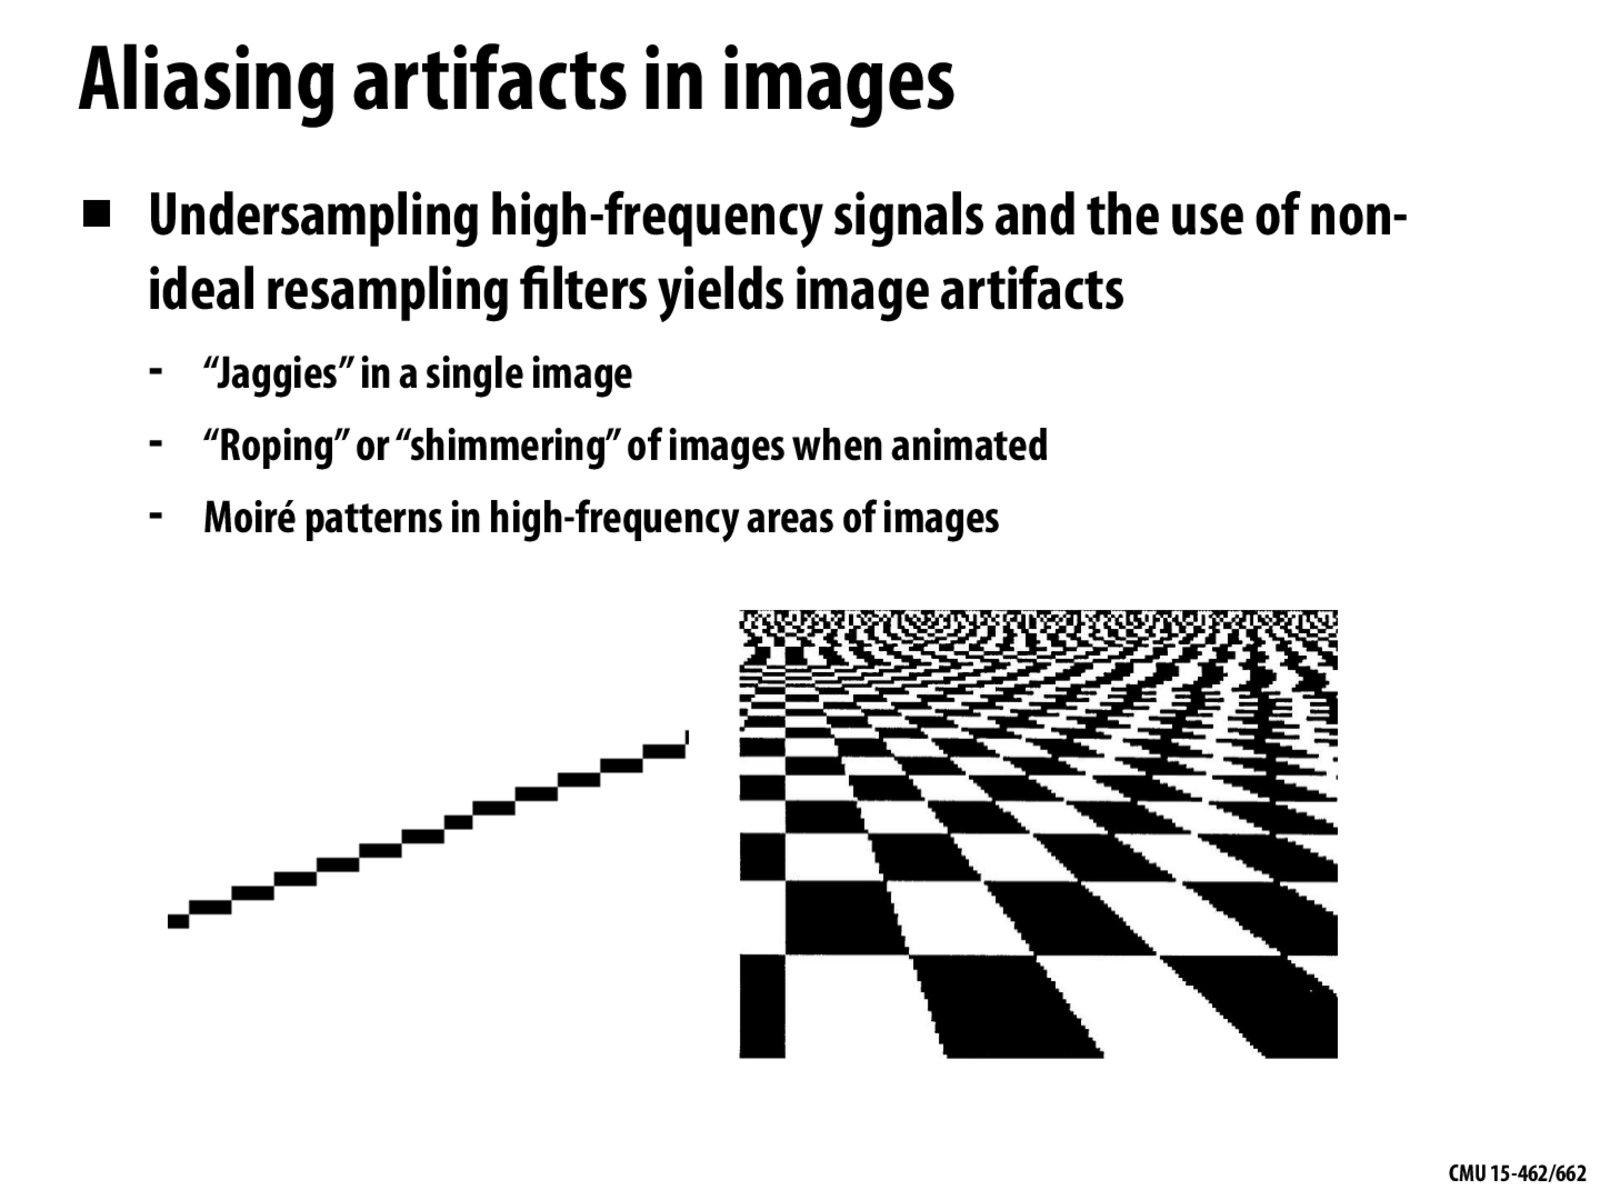
This bottom-right row shows a perspective view of a checkerboard pattern. We can represent this view of a checkerboard with some function f(x,y) for any real-valued arguments x and y. For this checkerboard function, the fesult of f(x,y) is either 1 (white square) or 0 (black square). The challenge here is that it is not easy to represent the high-frequency signal associated with this view of the checkerboard from a discrete set of samples that are either 0 or 1.
I also carelessly threw around the word "continuous" in class when talking about functions like f(x,y). f(x,y) has discontinuities here, since it jumps from 0 to 1. The intent was to highlight that the variables of f(x,y) are real valued, in contrast to our discrete samples used to represent this function.
(Also, I didn't quite understand the point regarding intersecting lines. Perhaps you can expand on this.)
The weird patterns in the back were explained using aliasing, but I don't understand why this is being represented by a continuous function (like the signals) rather than say a set of intersecting lines.
This bottom-right row shows a perspective view of a checkerboard pattern. We can represent this view of a checkerboard with some function
f(x,y)for any real-valued argumentsxandy. For this checkerboard function, the fesult off(x,y)is either 1 (white square) or 0 (black square). The challenge here is that it is not easy to represent the high-frequency signal associated with this view of the checkerboard from a discrete set of samples that are either 0 or 1.I also carelessly threw around the word "continuous" in class when talking about functions like
f(x,y).f(x,y)has discontinuities here, since it jumps from 0 to 1. The intent was to highlight that the variables off(x,y)are real valued, in contrast to our discrete samples used to represent this function.(Also, I didn't quite understand the point regarding intersecting lines. Perhaps you can expand on this.)