A lot of students have asked about the math of trilinear interpolation in office hours. Let's see if you can help me explain it here.
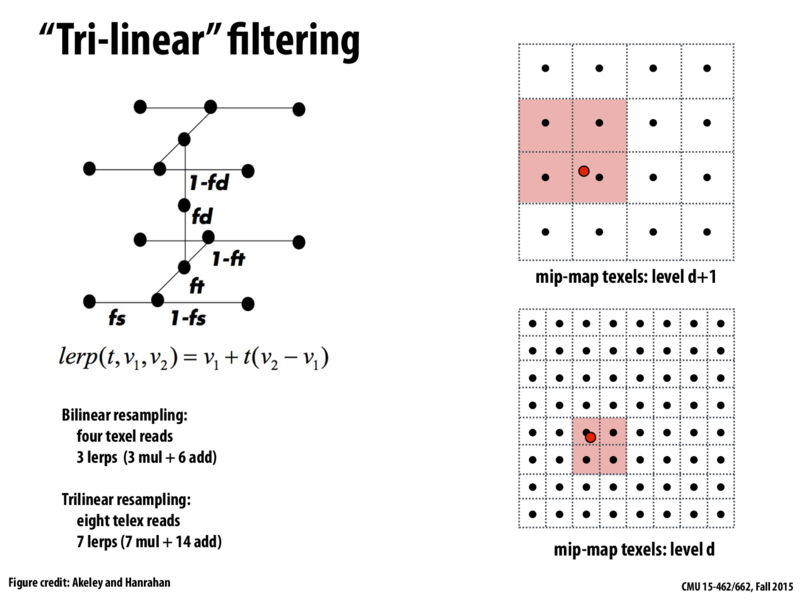
In this figure, the red dot corresponds to a coordinate (u,v) in texture space. The black dots correspond to the location in (u,v)-space of measurements of the texture signal f(u,v). Recall that measurements are just the value of the pixels in the input texture image. (We often call these measurements "texels".)
First, review slide 16 to see how we used linear interpolation to reconstruct the value f(u) at an arbitrary point u in 1D. Now, can someone give me the math of reconstructing the value of f(u,v) at (u,v) as the bilinear interpolation of the relevant samples using three linear interpolations.
Now consider a mipmap, which you can think of as describing a 3D volume of samples as shown at left (and also illustrated on slide 47. Each horizontal plane in the volume is a texture image (one level of the mipmap) and increasing mapmap levels are stacked vertically on top of each other (the d=0 image is at the bottom).
Finally, given that you understand both linear and bilinear interpolation, describe how trlinear interpolation can be built using linear- and bilinear- interpolations.
A lot of students have asked about the math of trilinear interpolation in office hours. Let's see if you can help me explain it here.
In this figure, the red dot corresponds to a coordinate (u,v) in texture space. The black dots correspond to the location in (u,v)-space of measurements of the texture signal
f(u,v). Recall that measurements are just the value of the pixels in the input texture image. (We often call these measurements "texels".)First, review slide 16 to see how we used linear interpolation to reconstruct the value
f(u)at an arbitrary pointuin 1D. Now, can someone give me the math of reconstructing the value off(u,v)at(u,v)as the bilinear interpolation of the relevant samples using three linear interpolations.Now consider a mipmap, which you can think of as describing a 3D volume of samples as shown at left (and also illustrated on slide 47. Each horizontal plane in the volume is a texture image (one level of the mipmap) and increasing mapmap levels are stacked vertically on top of each other (the d=0 image is at the bottom).
Finally, given that you understand both linear and bilinear interpolation, describe how trlinear interpolation can be built using linear- and bilinear- interpolations.