Did anyone get a good intuitive/geometric explanation of this?
The way I understand it is this:
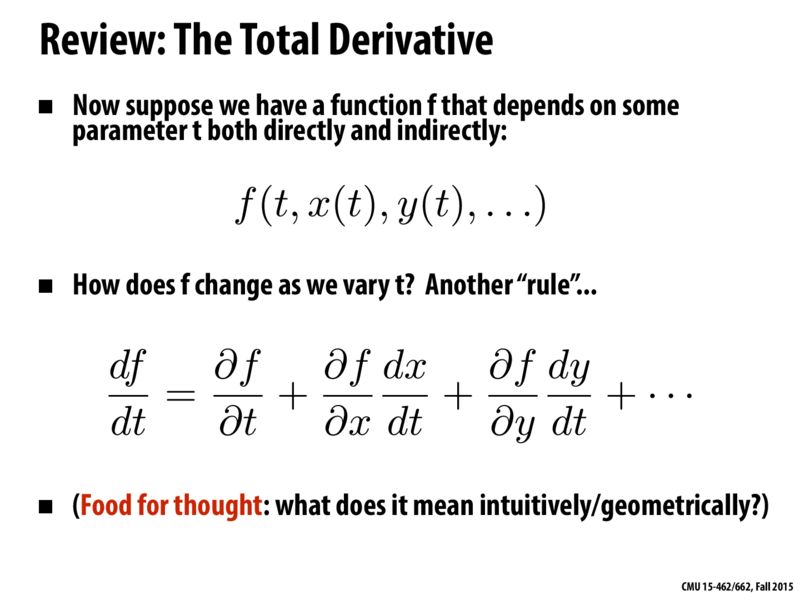
If we want the total amount f changes in t dependent on x, y, etc., then we first take how much f changes as if x, y, etc. did not change. Then, we add the contribution of change from x(t), y(t), ... Each of these contributions I think of as sort of the amount that variable changes (dx/dt) multiplied by a weight (partial of f with respect to x) of how much x(t) affects f.
Is my thinking correct? Anyone have a more visual representation of this?
lucida
Here's a (dismal) example of this equation.
Say f is the function measuring your likelihood of death. Let t be the amount you smoke.
t directly affects your likelihood of death through cancer. That's df/dt.
Say the amount you work out is measured by x. Say smoking decreases the amount you work out by some rate (because you're lungs aren't doing so well), that's dx/dt. But working out less also increases your likelihood of death. That's df/dx. So the indirect increase in likelihood of death caused by smoking affecting amount of physical activity is df/dx * dx/dt.
So total increase in likelihood of death due to smoking is df/dt + df/dx * dx/dt.
Did anyone get a good intuitive/geometric explanation of this?
The way I understand it is this:
If we want the total amount f changes in t dependent on x, y, etc., then we first take how much f changes as if x, y, etc. did not change. Then, we add the contribution of change from x(t), y(t), ... Each of these contributions I think of as sort of the amount that variable changes (dx/dt) multiplied by a weight (partial of f with respect to x) of how much x(t) affects f.
Is my thinking correct? Anyone have a more visual representation of this?
Here's a (dismal) example of this equation.
Say f is the function measuring your likelihood of death. Let t be the amount you smoke. t directly affects your likelihood of death through cancer. That's df/dt.
Say the amount you work out is measured by x. Say smoking decreases the amount you work out by some rate (because you're lungs aren't doing so well), that's dx/dt. But working out less also increases your likelihood of death. That's df/dx. So the indirect increase in likelihood of death caused by smoking affecting amount of physical activity is df/dx * dx/dt.
So total increase in likelihood of death due to smoking is df/dt + df/dx * dx/dt.