What should we do if the inverse could not be easily calculated?
Why the histogram looks similar as the blue curve?
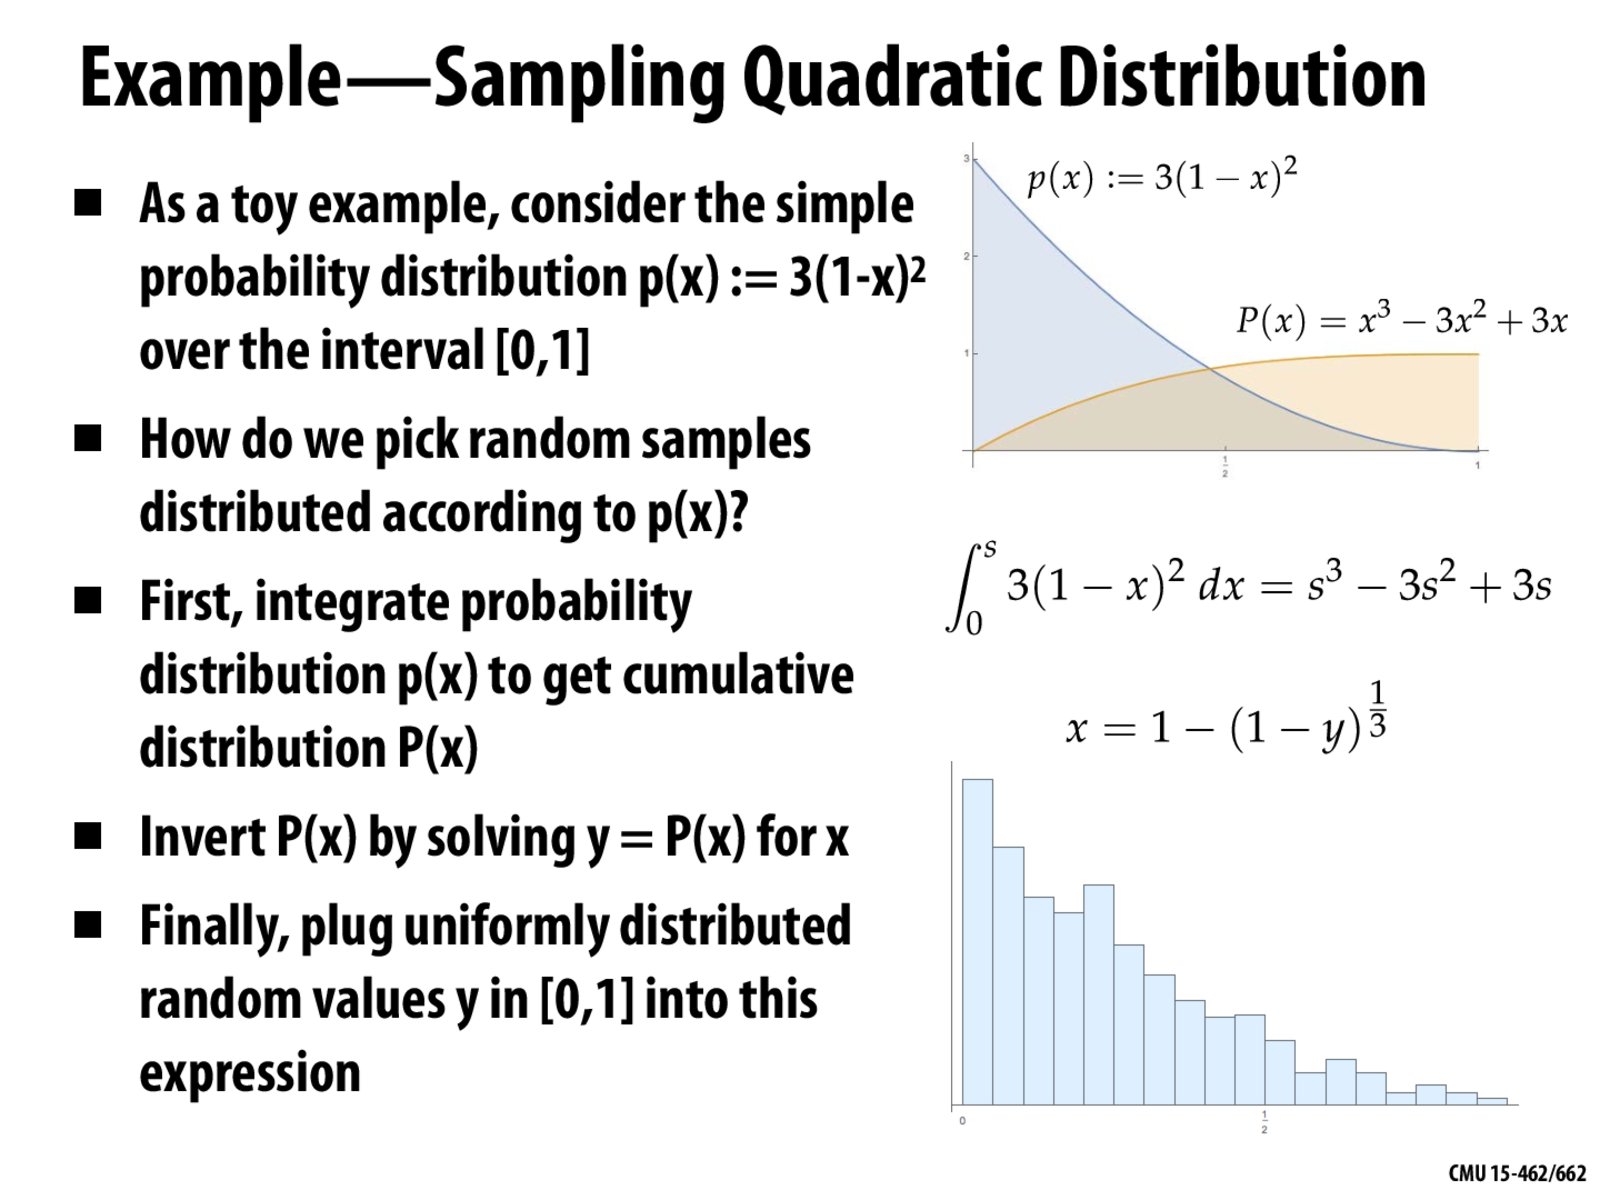
The histogram is the sampling result of our target function p(x).
What should we do if the inverse could not be easily calculated?
Why the histogram looks similar as the blue curve?
The histogram is the sampling result of our target function p(x).