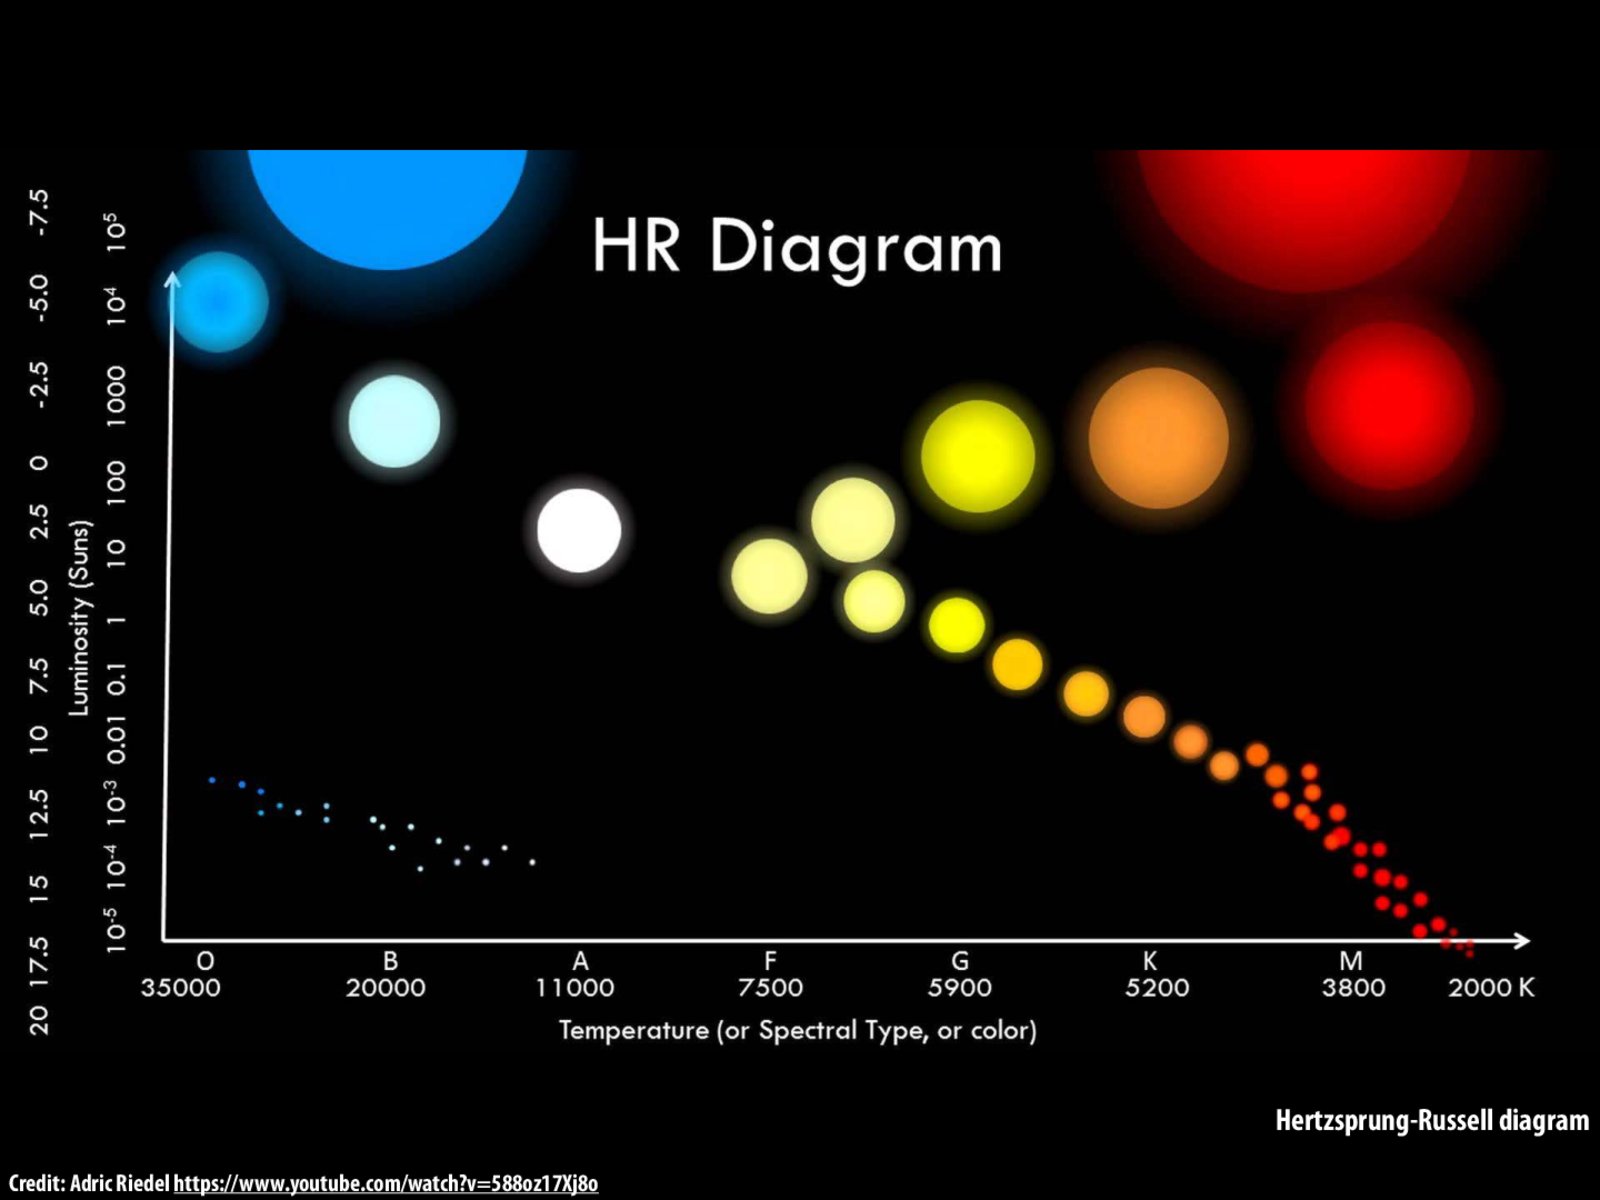
Fun fact: There's a historical reason for the x axis of an HR diagram to be going backwards. Originally, it plotted luminosity as a function of wavelength, or color, with longer wavelengths being further along the x axis, since spectral types are correlated with color. When astronomers actually figured out that what they had been detecting the whole time was temperature, they kept the convention.
Fun fact: There's a historical reason for the x axis of an HR diagram to be going backwards. Originally, it plotted luminosity as a function of wavelength, or color, with longer wavelengths being further along the x axis, since spectral types are correlated with color. When astronomers actually figured out that what they had been detecting the whole time was temperature, they kept the convention.