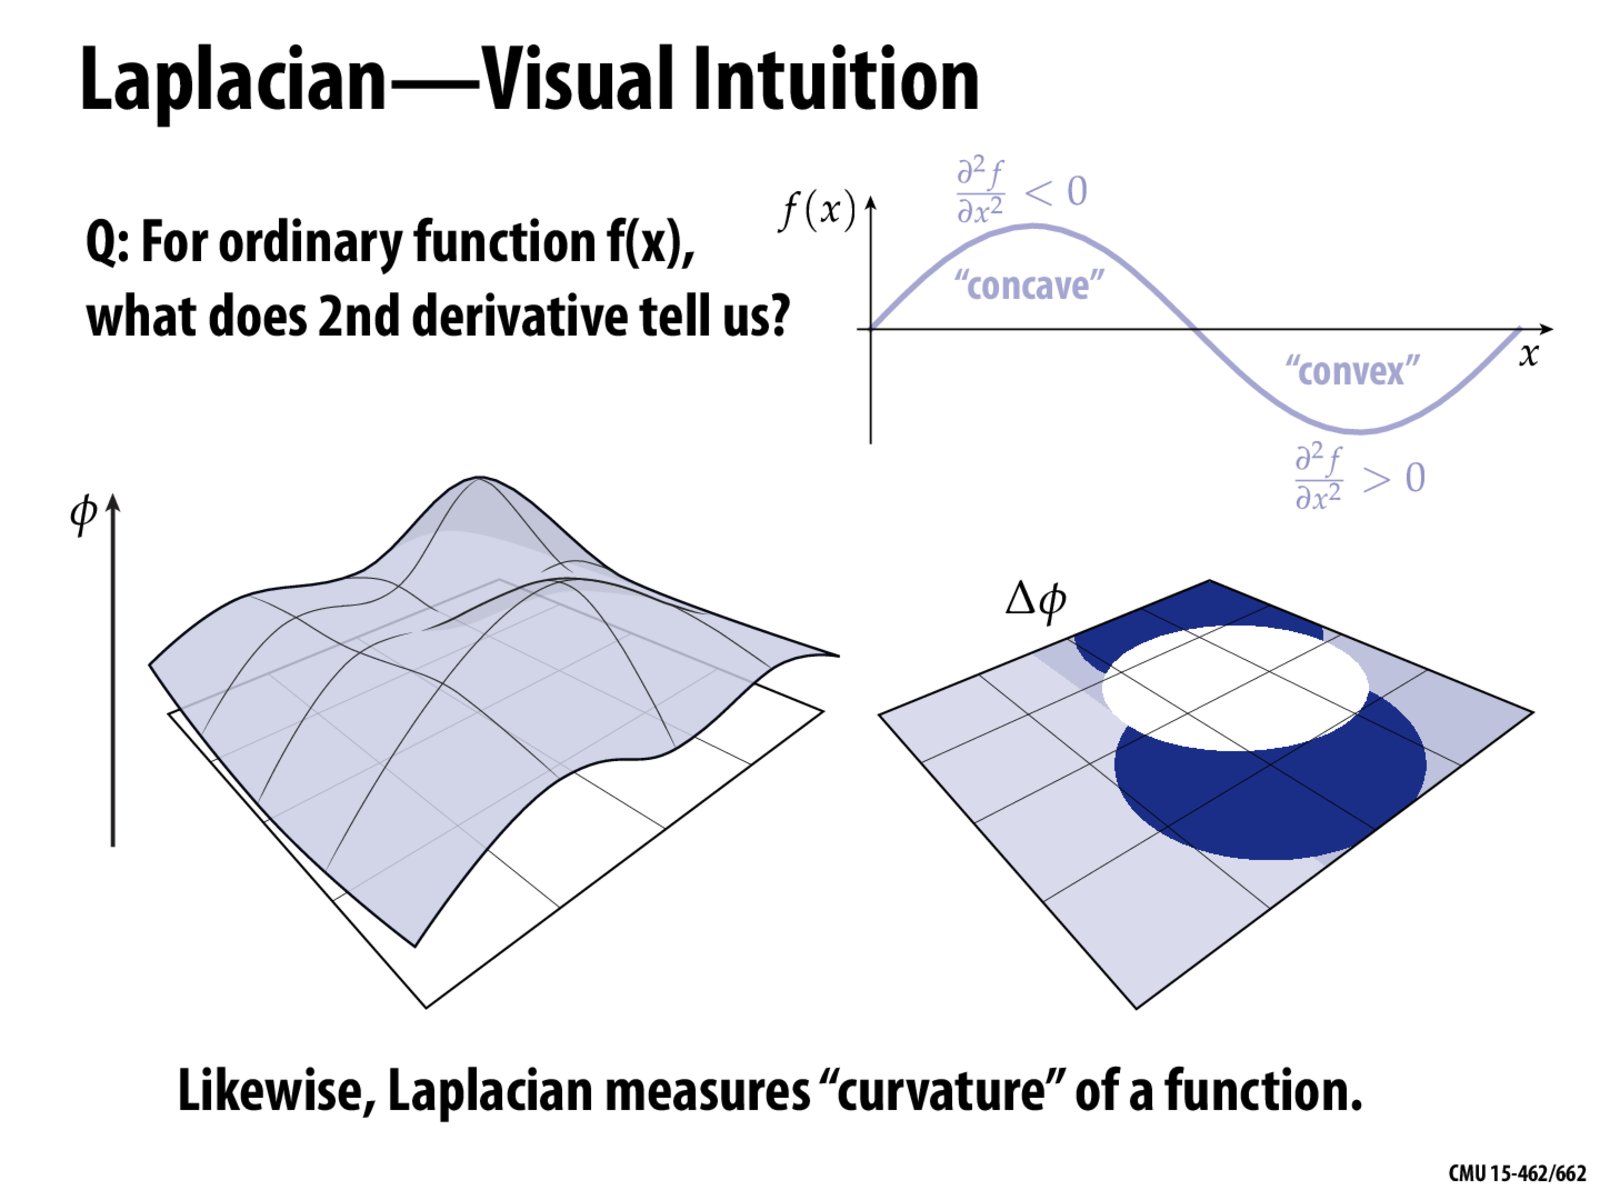
Is the second picture just supposed to be an approximation of the laplacian of phi? I dont see how the plot on the right has anything to do with the curvature of the graph on the left. Also, will we be working with the discrete laplacian similarly to how we did in Discrete Differential Geometry?
motoole2
There are some bugs getting these slides online, and somehow it's affecting these plots. The plot on the right should look like the following:
motoole2
Oh, and as for the question regarding working with Laplacians, you won't see as much of it as in 15-458: Discrete Differential Geometry.
Is the second picture just supposed to be an approximation of the laplacian of phi? I dont see how the plot on the right has anything to do with the curvature of the graph on the left. Also, will we be working with the discrete laplacian similarly to how we did in Discrete Differential Geometry?
There are some bugs getting these slides online, and somehow it's affecting these plots. The plot on the right should look like the following:
Oh, and as for the question regarding working with Laplacians, you won't see as much of it as in 15-458: Discrete Differential Geometry.