On these slides, are the spectrums on the right the "power spectrums", that is, without the phase information?
motoole2
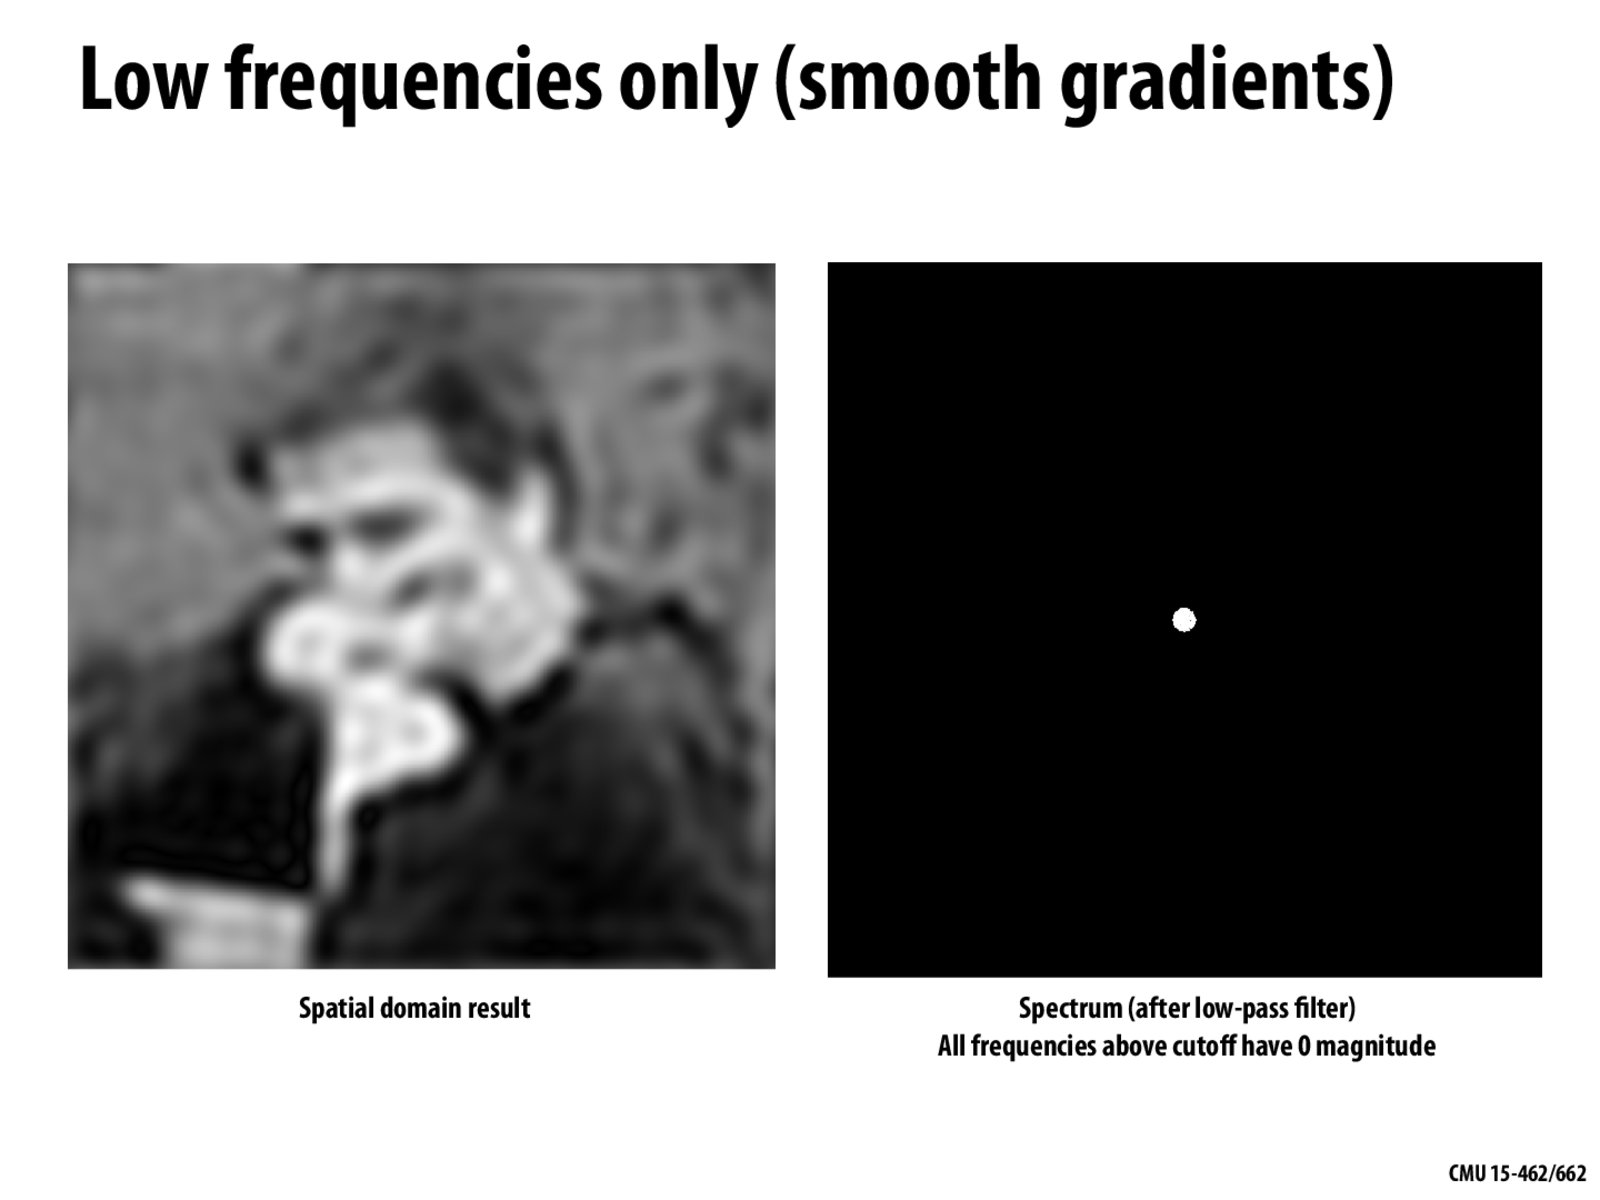
Yes---this is only showing the magnitude of specific frequencies, and indicates how much each frequency contributes to the image on the left. The spectrum is defined as either the absolute value of the Fourier transform (magnitude spectrum) or the absolute value squared of the Fourier transform (power spectrum).
On these slides, are the spectrums on the right the "power spectrums", that is, without the phase information?
Yes---this is only showing the magnitude of specific frequencies, and indicates how much each frequency contributes to the image on the left. The spectrum is defined as either the absolute value of the Fourier transform (magnitude spectrum) or the absolute value squared of the Fourier transform (power spectrum).