[This quiz is due at the start of class on Thursday, 9/12.]
In class today, we started talking about the Fourier / frequency domain representation of signals. The basic idea is that you can break down a signal into basis signals that oscillate at different rates. Loosely speaking, "high frequency" means that you have a lot of oscillations over a small period of time, or small distance in space; "low frequency" means the opposite: very few oscillations over a large distance or long duration.
For our class, you won't need to understand the Fourier transform in great technical detail. However, as you continue in graphics you will definitely find it helpful to be able to think conceptually about the "frequency" of an image, shape, animation, etc. You're welcome to use any resource you like to learn more; the Wikipedia pages on the Fourier transform and the frequency domain are ok, but feel free to explore and find references that you find helpful and intuitive. For instance, here's a fun video, and here's a neat JavaScript application.
Here's some discussion (thanks to @harveybia) that gives some intuition for the frequencies of a 2D image, as well as a great movie showing what happens when you include more and more frequencies in the Fourier decomposition.
In general, there are many ways to study the frequency content in a signal; in class we talked briefly about the 2D Fourier transform of an image. Just like the 1D Fourier transform, the basic idea is that the 2D Fourier transform provies information about how much of the signal is concentrated in high and low frequencies. One way to plot this data is via another 2D image, of the kind shown in the right side of each image pair below. (These images really just plot the magnitude of the transform; we'll ignore phase for now.)
Values near the center of the image correspond to low frequencies, with the very center pixel corresponding to the constant component, i.e., an image where all pixels have the same color. Pixels further along the x-axis correspond to higher and higher frequencies in the horizontal direction, and likewise for the y-axis. For instance, an image that looks like f(x,y) = cos(100x) + cos(y) has a high "horizontal frequency" but a low "vertical frequency". Here are a few basic examples:
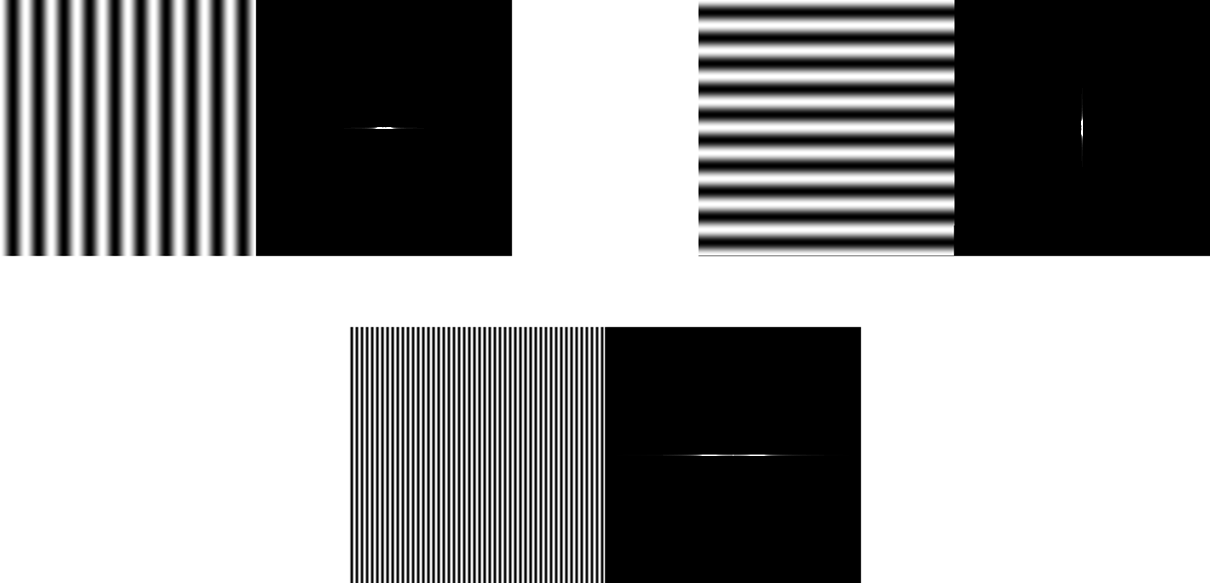
In each pair, the input image is on the left, and the magnitude of its 2D Fourier transform is on the right. Notice that the orientation of the features in the image corresponds to the axis along which the Fourier transform has large values. Also notice that the higher frequency image at the bottom has Fourier coefficients spread out further along the x-axis than in the lower-frequency image in the top-left.
Here's what a sum of the top two images looks like when we apply the Fourier transform:

Notice that the Fourier transform of the sum looks a lot like the sum of the Fourier transform! (If you remember our review of linear algebra, this should come as no surprise: the Fourier transform is basically just a change of basis.).
In general, an image is the sum of many different frequencies in many different directions. Looking at a Fourier transform gives you a good sense of how these frequencies are distributed.
Question 1: Fourier Transform of Images
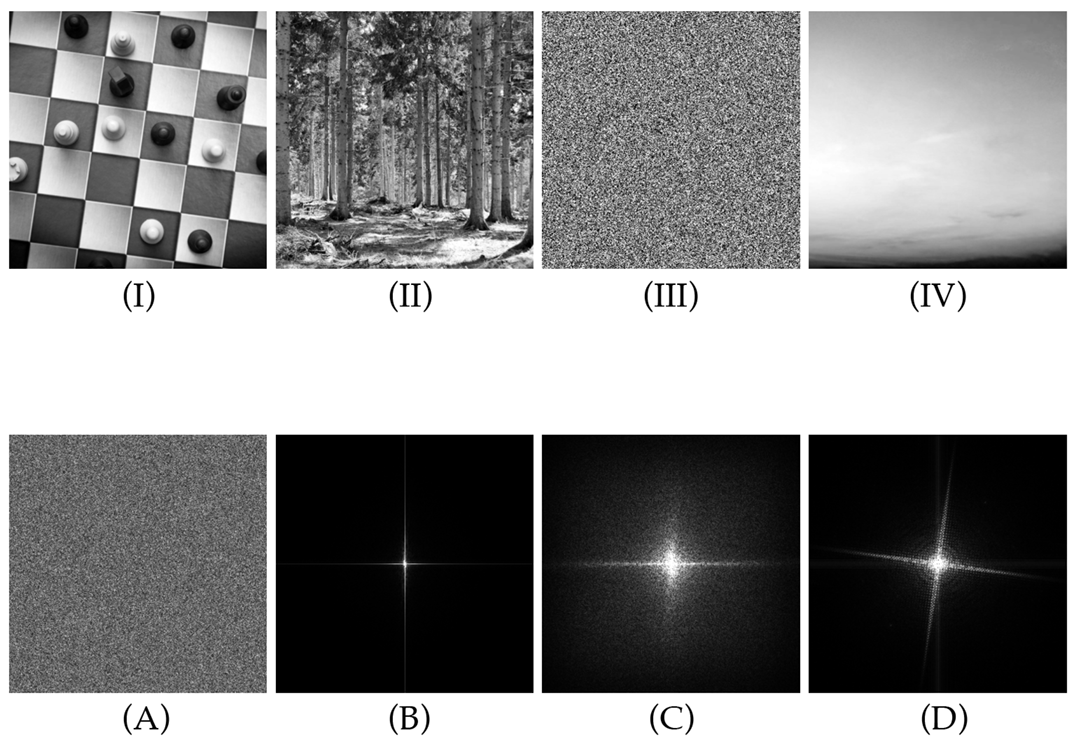
For each of the images (I-IV) above, which of the 2D Fourier transformations (A-D) do you think corresponds the best? Each Fourier transform should correspond to exactly one image. In each case, explain why you think this is the right choice.
Question 2: Spectra of Surfaces
Although we didn't talk about it much in class, you can also compute a Fourier-like transform for surfaces. The basic idea is to replace sines and cosines with the "fundamental vibrations" of the surface, or more precisely, with the eigenvectors (really, eigen_functions_) of something called the Laplace-Beltrami operator. This idea is the starting point for Spectral Geometry Processing (which you are not requried to know about for this quiz!)
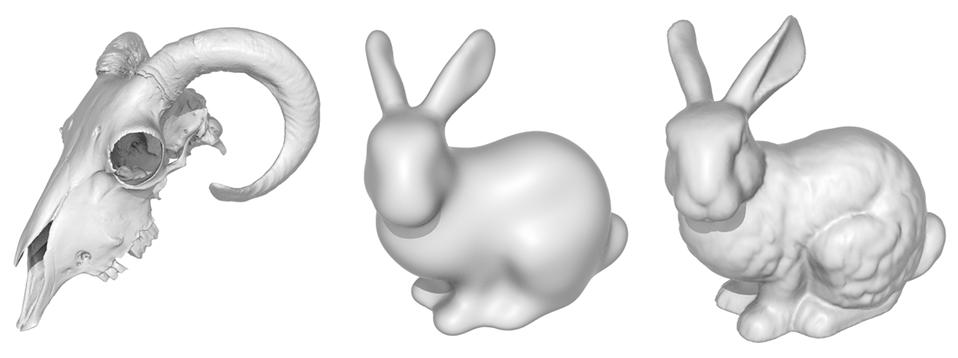
For now, just make a guess: which of the three surfaces above do you think has:
- the most high frequencies,
- the most low frequencies,
and why?