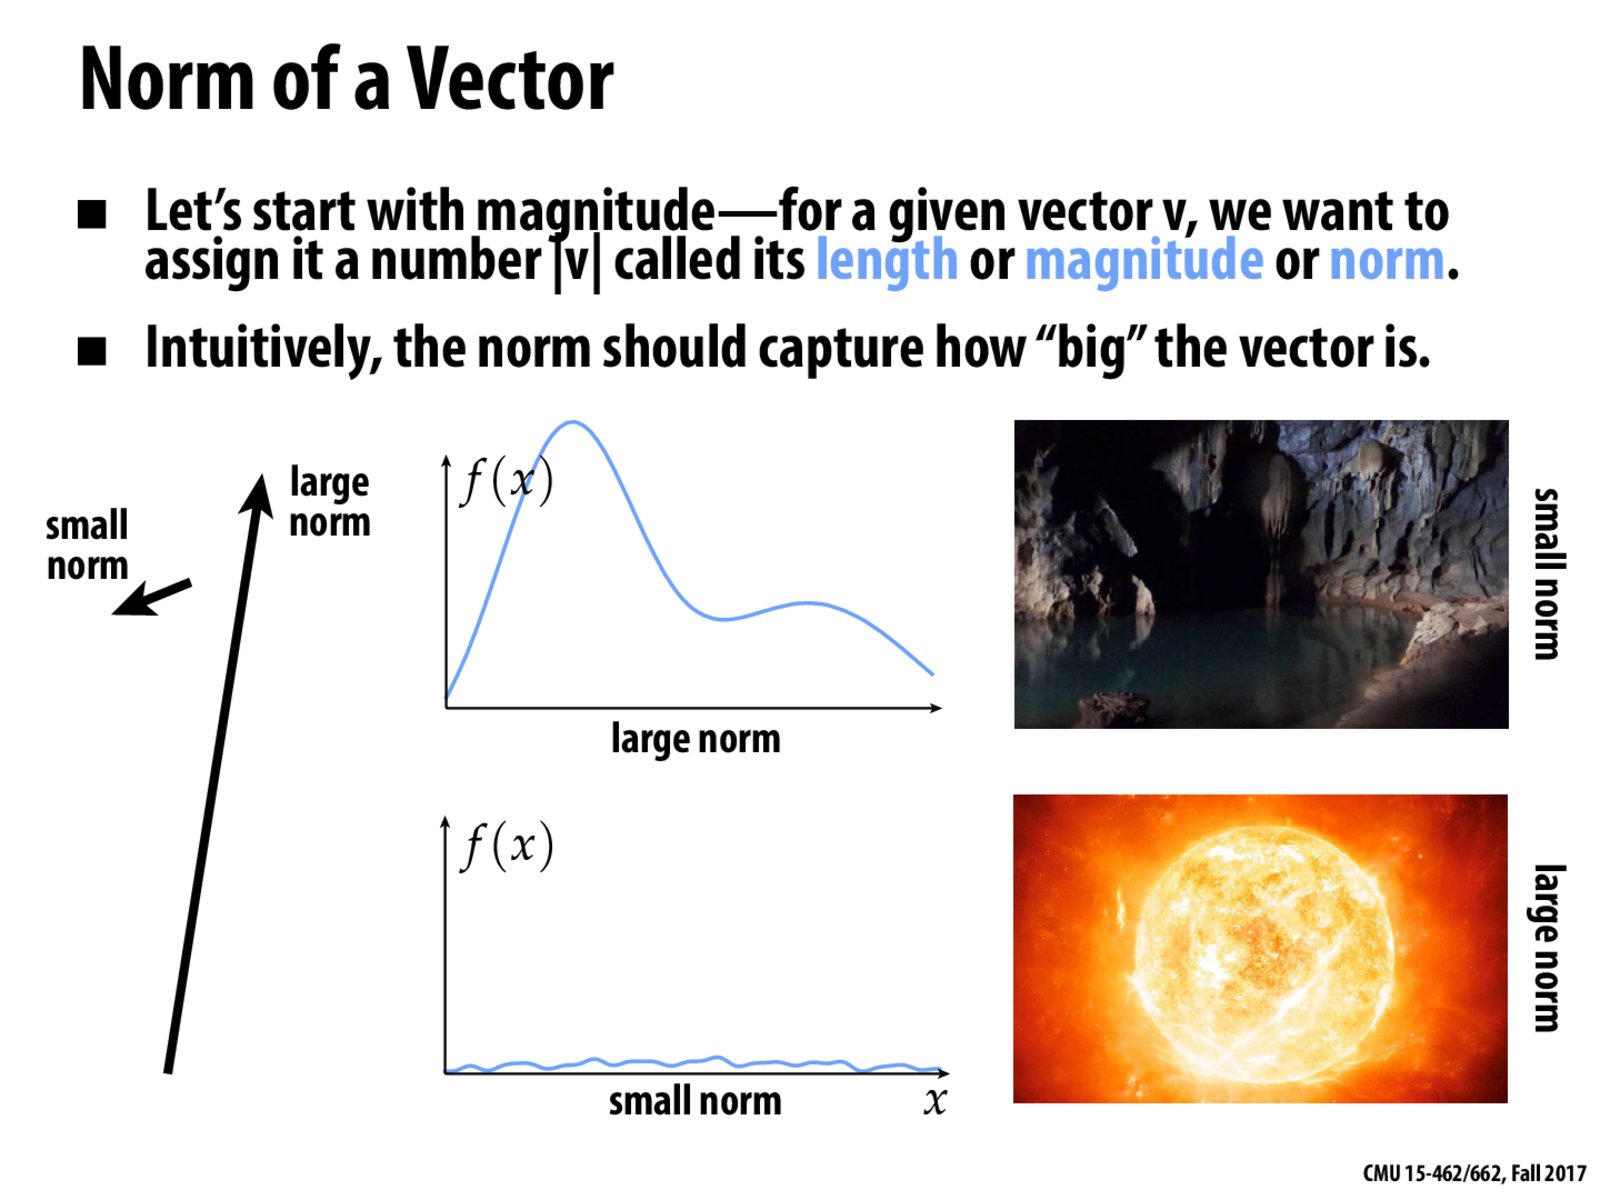
I didn't understand why the upper function has a larger norm than the lower one. Could someone explain?
aabhagwa
@atayal - I think that we were just trying to intuitively rate things as 'high norm' or 'low norm' (at least on this slide).
keenan
Right. Here we're just trying to build some intuition for what it looks like when a vector (or function) has large or small norm. For functions on an interval (blue curves) we more carefully define the L^2 norm on this slide.
aluk
During the lecture, we constantly talked about how an image would can be simply described as a function. Are there multiple ways of doing this or will it simply be the color value as a function of the (x,y) coordinate values?
keenan
@aluk Right, that's a good way to think about it. The next question is: how do you encode a color value? Unfortunately this one is not so easy, since there are a huge number of possible color spaces (RGB, CMYK, XYZ, ...), each suited to a different purpose (display, print, compression, ...). We'll spend a fair bit of time talking about representations of color later in the course.
I didn't understand why the upper function has a larger norm than the lower one. Could someone explain?
@atayal - I think that we were just trying to intuitively rate things as 'high norm' or 'low norm' (at least on this slide).
Right. Here we're just trying to build some intuition for what it looks like when a vector (or function) has large or small norm. For functions on an interval (blue curves) we more carefully define the L^2 norm on this slide.
During the lecture, we constantly talked about how an image would can be simply described as a function. Are there multiple ways of doing this or will it simply be the color value as a function of the (x,y) coordinate values?
@aluk Right, that's a good way to think about it. The next question is: how do you encode a color value? Unfortunately this one is not so easy, since there are a huge number of possible color spaces (RGB, CMYK, XYZ, ...), each suited to a different purpose (display, print, compression, ...). We'll spend a fair bit of time talking about representations of color later in the course.